Analytics
Track your event's performance with charts and engagement statistics. Monitor registrations, attendance, and participant activity.
Prerequisites
- A published event with participant activity
Accessing Analytics
From your event dashboard, click Analytics in the sidebar navigation.
Available Metrics
Registration Trends
A line chart showing registration counts over time. Identify peak registration periods and plan your marketing accordingly.
Attendance Rate
Compare total registrations vs. actual check-ins to measure your event's attendance rate.
Engagement Statistics
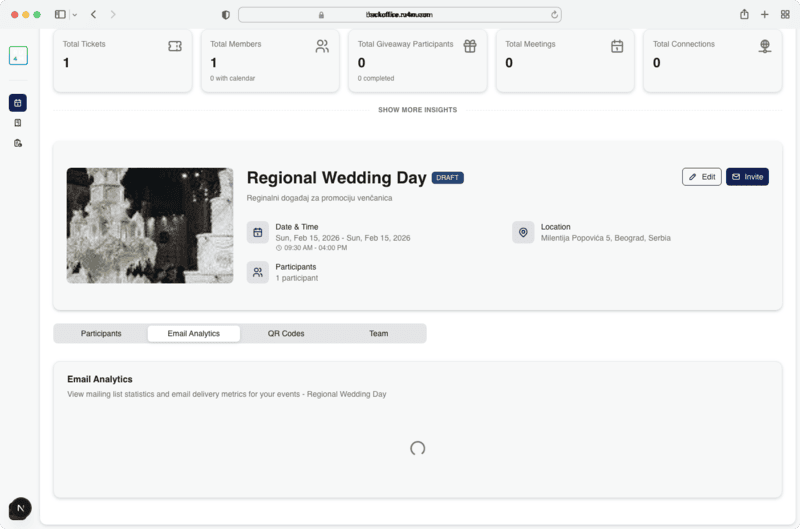
Key metrics displayed as summary cards:
- Total registrations -- Number of people who signed up
- Check-ins -- Number of attendees who arrived
- Page views -- How many times the event page was visited
- Conversion rate -- Percentage of page visitors who registered
Revenue Overview
For paid events, view total revenue, average ticket price, and revenue breakdown by ticket tier.
Data refresh
Analytics data refreshes periodically. Recent activity may take a few minutes to appear in the charts.
Use analytics to optimize
Monitor which marketing channels drive the most registrations by checking traffic spikes after promotional campaigns.
Next Steps
- View participants for detailed attendee data
- Send campaigns to boost registrations