Email Campaign Analytics
The Email Campaign Analytics dashboard gives you a complete overview of how your email campaigns are performing. You can track delivery metrics (how many emails were sent, delivered, and at what rate), engagement data (how many people opened your email or clicked on links), and potential issues (bounced emails, delivery failures, spam complaints, and unsubscribes).
This information helps you understand how effective your email campaigns are and whether your messages are reaching your audience.
There are two different ways to access the Email Campaign Analytics for a specific event. Both paths lead to the same analytics data — choose whichever is more convenient for you.
Path 1: Via the Side Menu
This path takes you to a dedicated analytics page where you can select any event and view its campaign analytics.
Open Email Campaign Analytics from the side menu
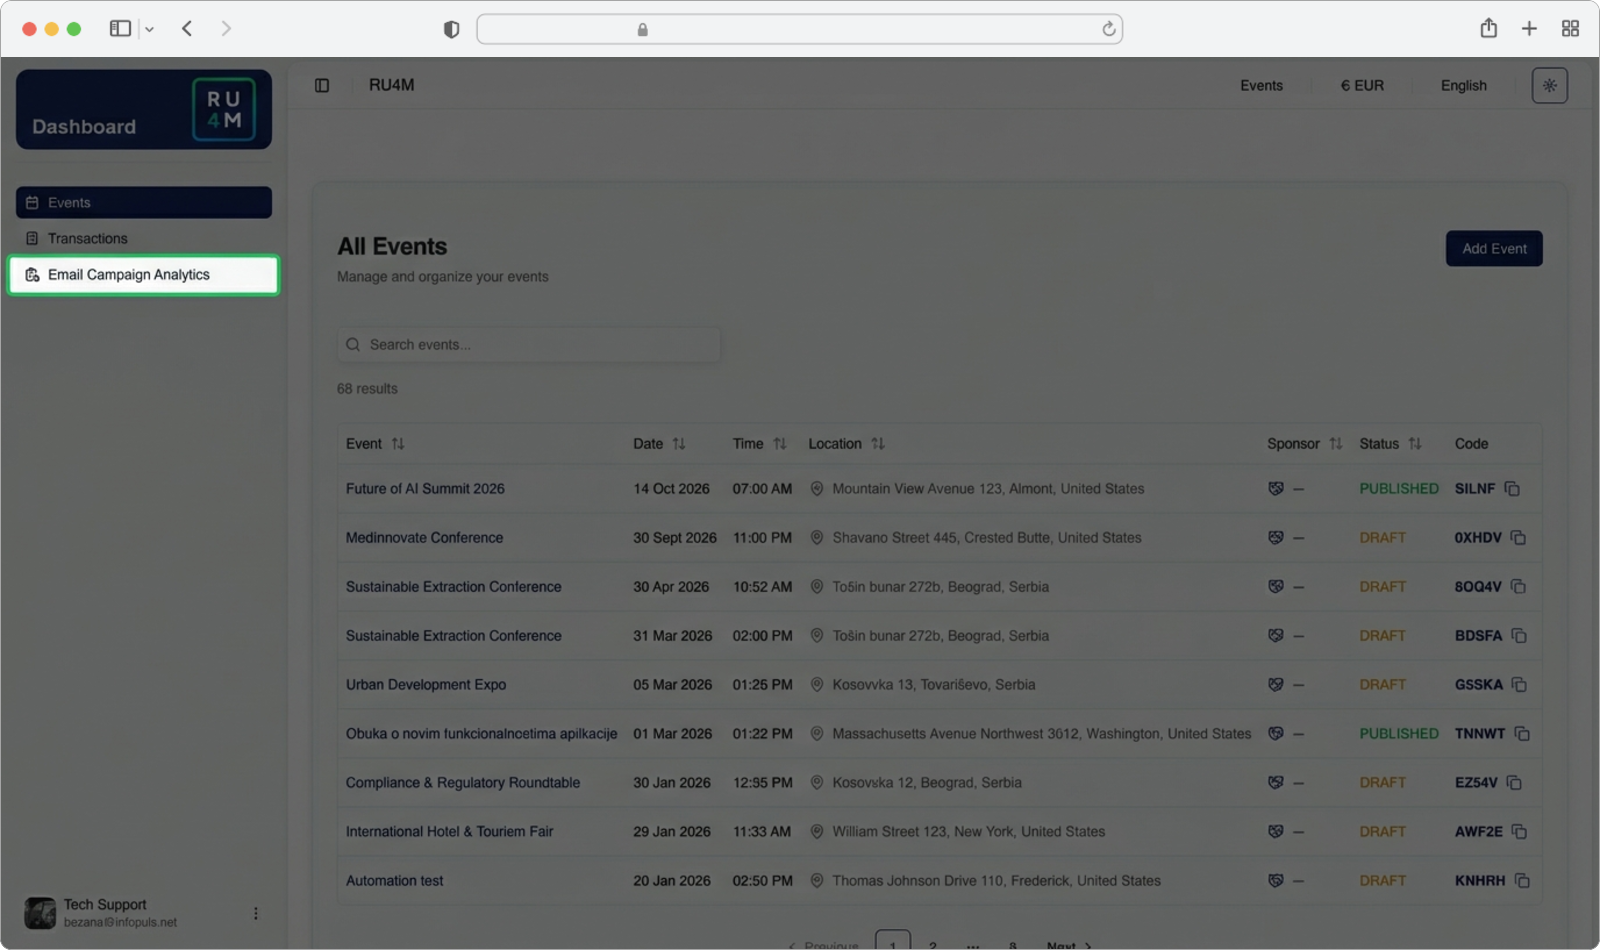
Look at the left side menu (the dark sidebar on the left edge of the page). You will see several menu options. Click on "Email Campaign Analytics" — it is the third option in the list, below "Events" and "Transactions".
The menu item will become highlighted, indicating you are now on the Email Analytics page. The main content area will display the "Email Analytics" heading with a subtitle that reads "View mailing list statistics and email delivery metrics for your events".
Select your event
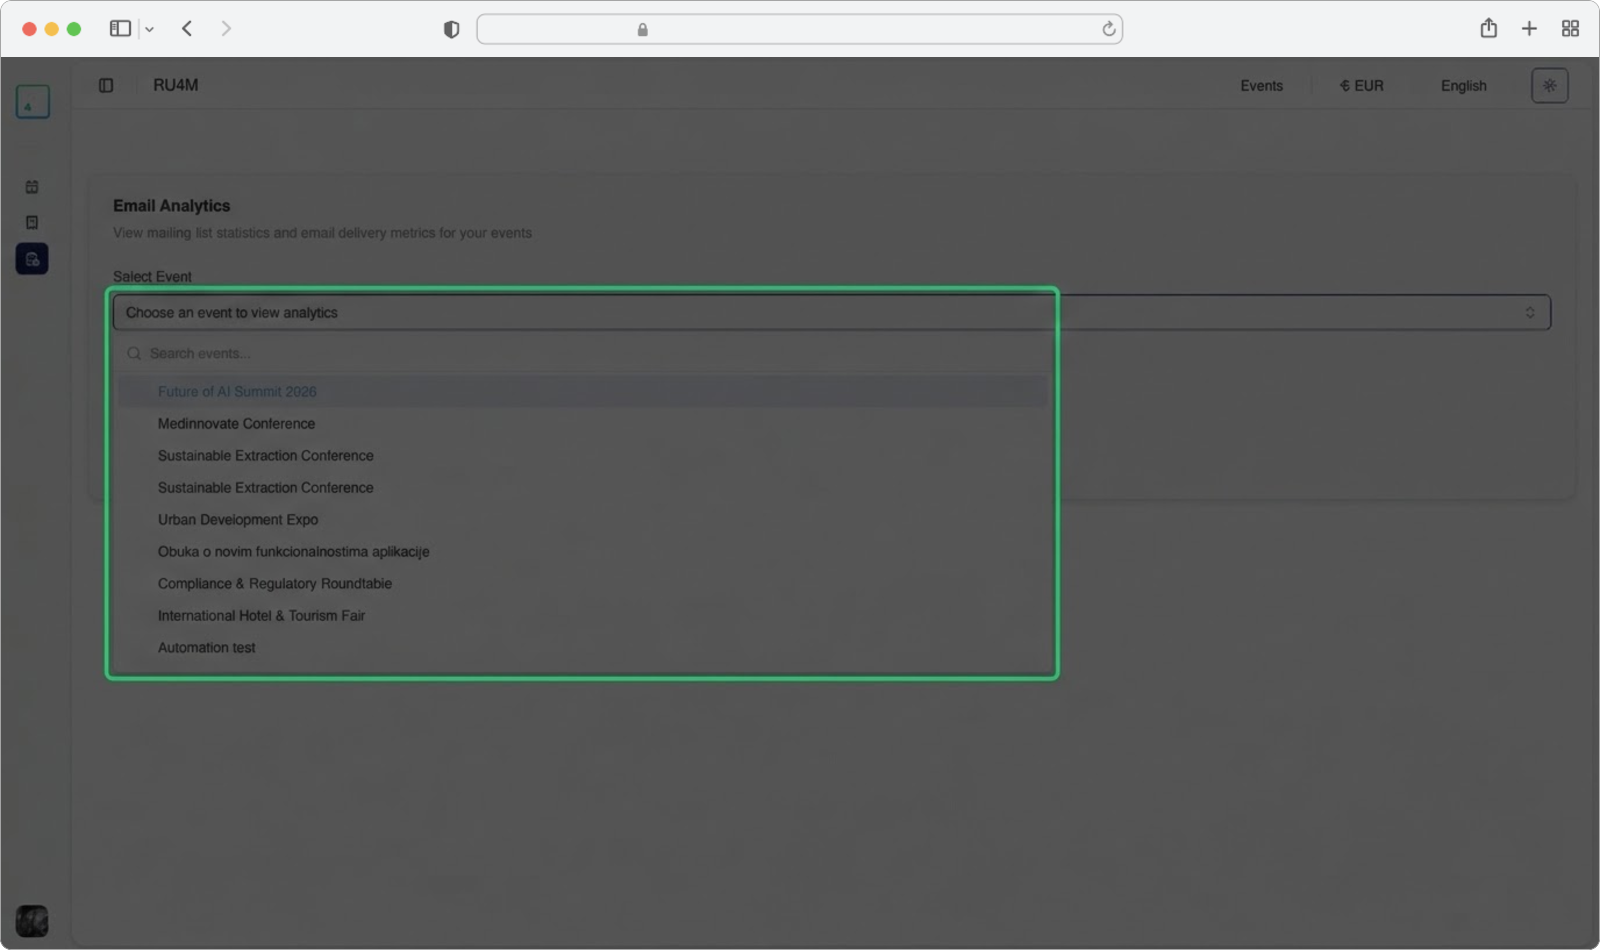
Below the heading, you will see a dropdown field labeled "Select Event" with placeholder text that says "Choose an event to view analytics".
Click on this dropdown field. A list will appear showing all the events you have created.
Search for a specific event
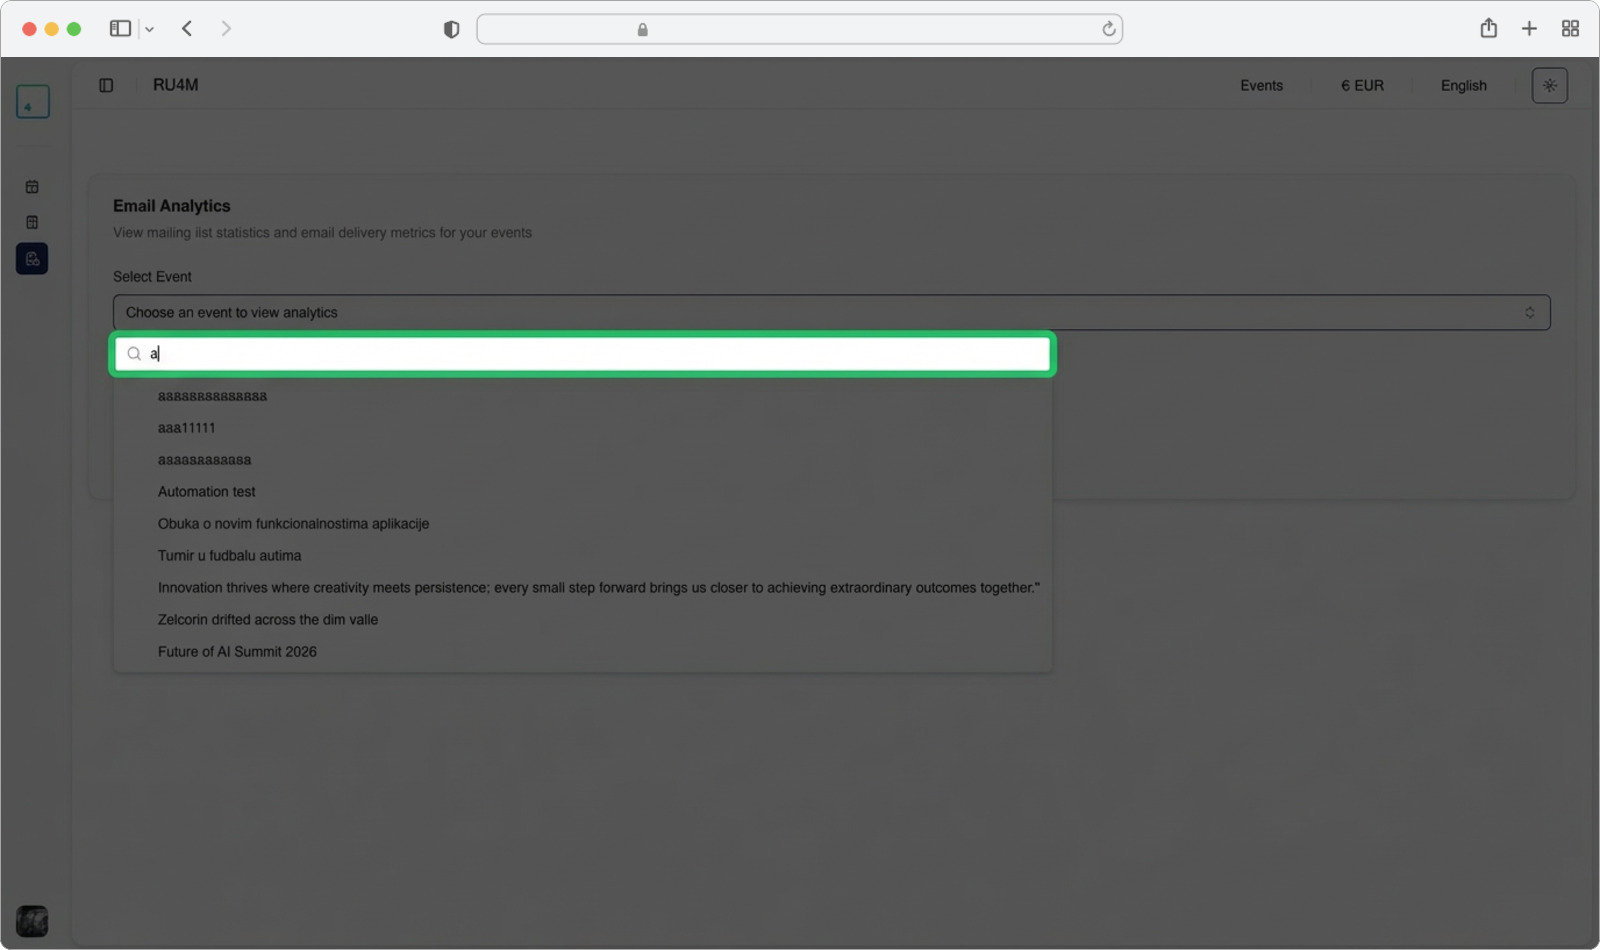
If you have many events, you can type in the search field at the top of the dropdown to filter the list. Start typing the name of the event whose analytics you want to see. The list will update in real time as you type.
Click on the event you want in the search results.
View the analytics dashboard
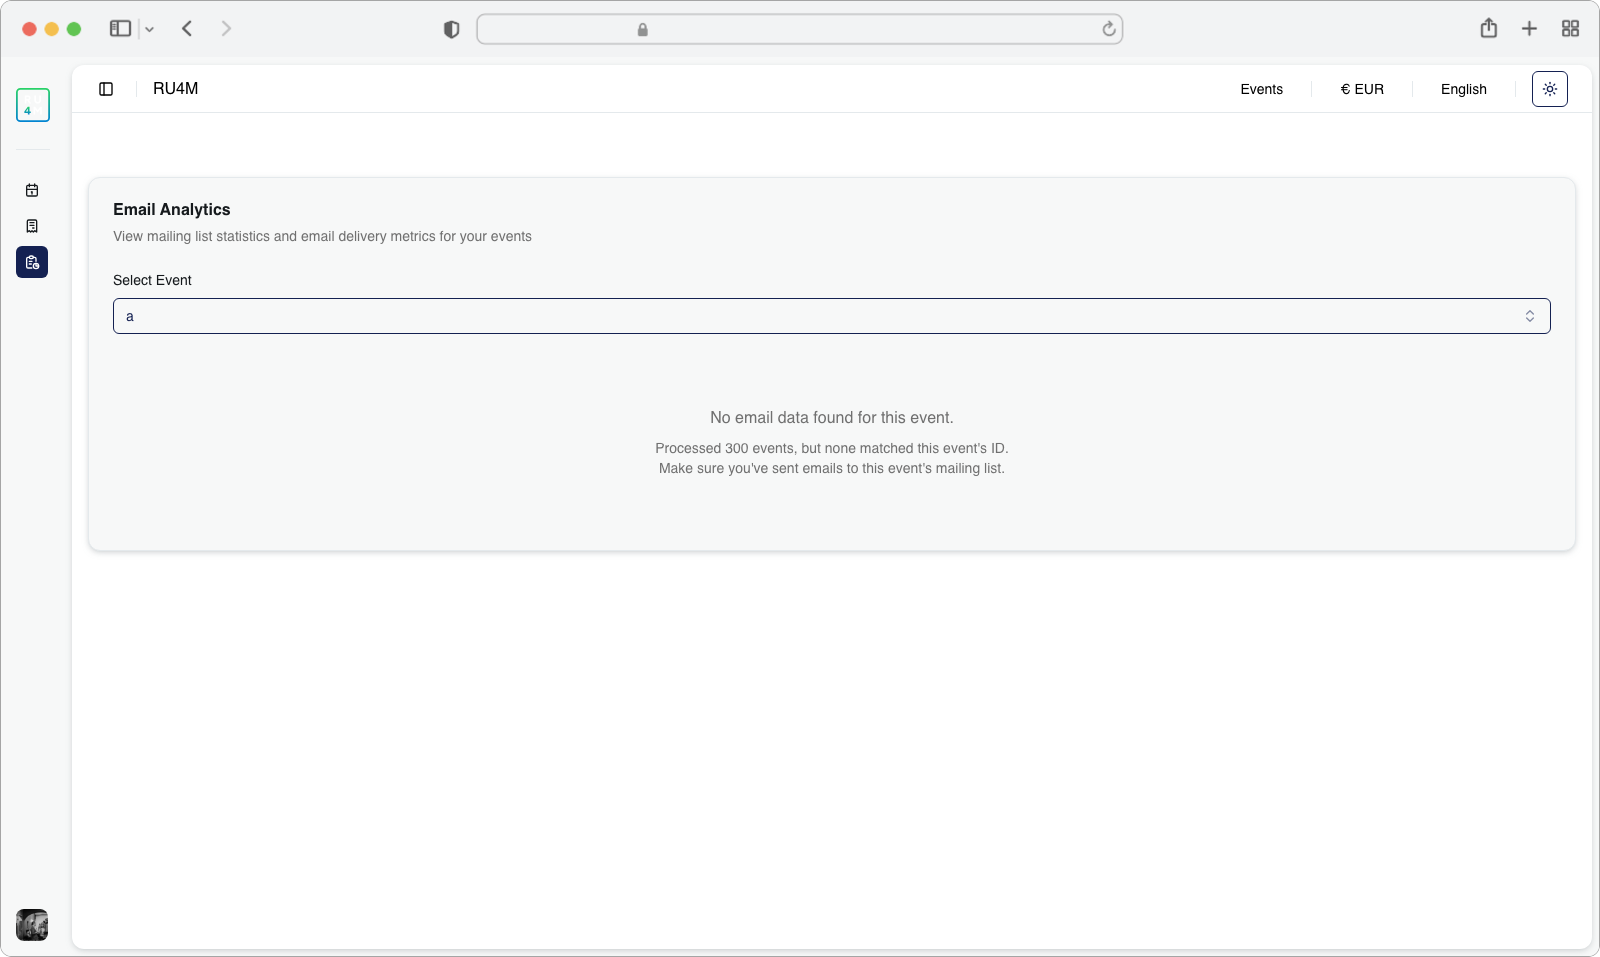
After selecting your event, the page will display the complete analytics dashboard for that event's email campaigns. The dashboard is organized into several sections:
Delivery Metrics — Three cards at the top showing:
- Total Sent — The total number of emails that were sent in your campaigns
- Delivered — How many of those emails successfully reached the recipients' inboxes
- Delivery Rate — The percentage of sent emails that were successfully delivered
Engagement — Four cards showing how recipients interacted with your email:
- Opens — How many recipients opened your email (with percentage)
- Clicks — How many recipients clicked on links inside your email (with percentage)
- Total Engaged — The total number of unique recipients who either opened or clicked
- Engagement Rate — The overall percentage of recipients who engaged with your email
Issues — Four cards showing potential problems:
- Bounced — Emails that could not be delivered to the recipient's inbox (with percentage)
- Failed — Emails that failed to send entirely
- Complaints — The number of recipients who marked your email as spam
- Unsubscribed — The number of recipients who opted out of future emails
Overview — A visual bar chart at the bottom that shows the proportion of delivered, bounced, failed, and other outcomes. Below the chart, you can see summary numbers for Sent, Delivered, Opens/Clicks, and Issues.
Understanding the metrics
A high Delivery Rate (above 95%) means your emails are reaching recipients successfully. A high Engagement Rate means your email content is relevant and interesting to your audience. If you see many Bounced or Failed emails, some email addresses on your list may be invalid or no longer active.
What does 'Bounced' mean?
When an email "bounces", it means the email could not be delivered to the recipient. This can happen for several reasons: the email address does not exist, the recipient's inbox is full, or the email was rejected by the recipient's email server. Consider removing bounced addresses from your mailing list to improve your delivery rate in future campaigns.
Path 2: Via the Event Page
This path is useful when you are already viewing a specific event's details and want to quickly check its email analytics.
Navigate to your event
On the Events page in the Dashboard, find your event. You can use the search bar to type the event name. Then click on the linked event name (it appears as a clickable link in the "Event" column of the table) to open that event's details page.
Open the Email Analytics tab
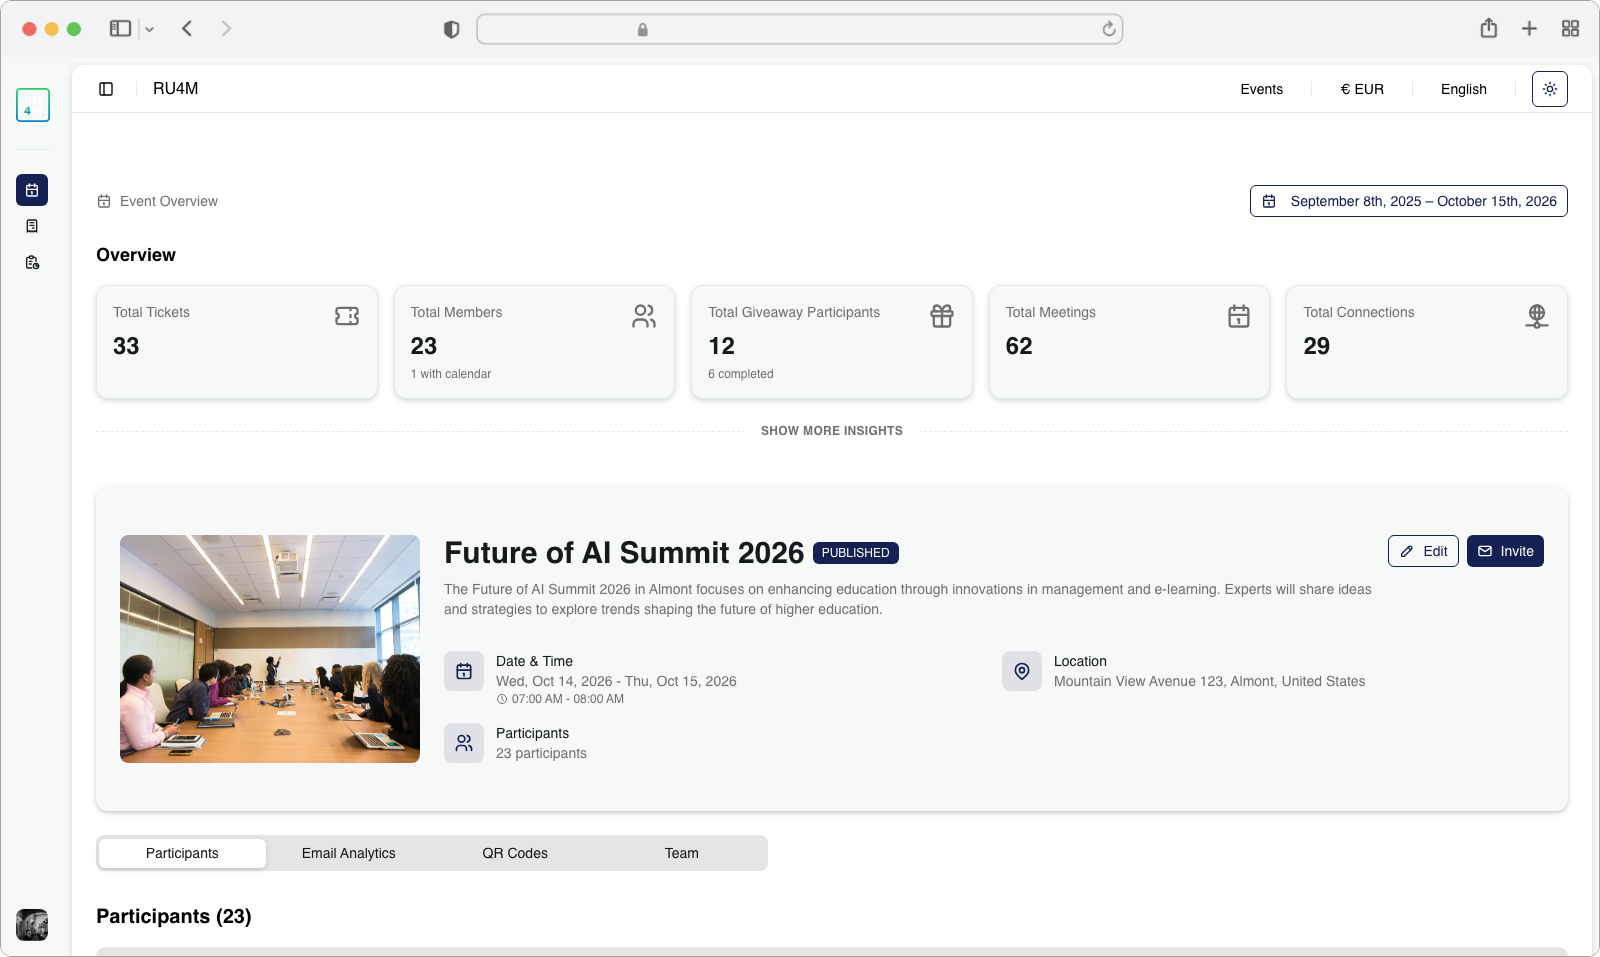
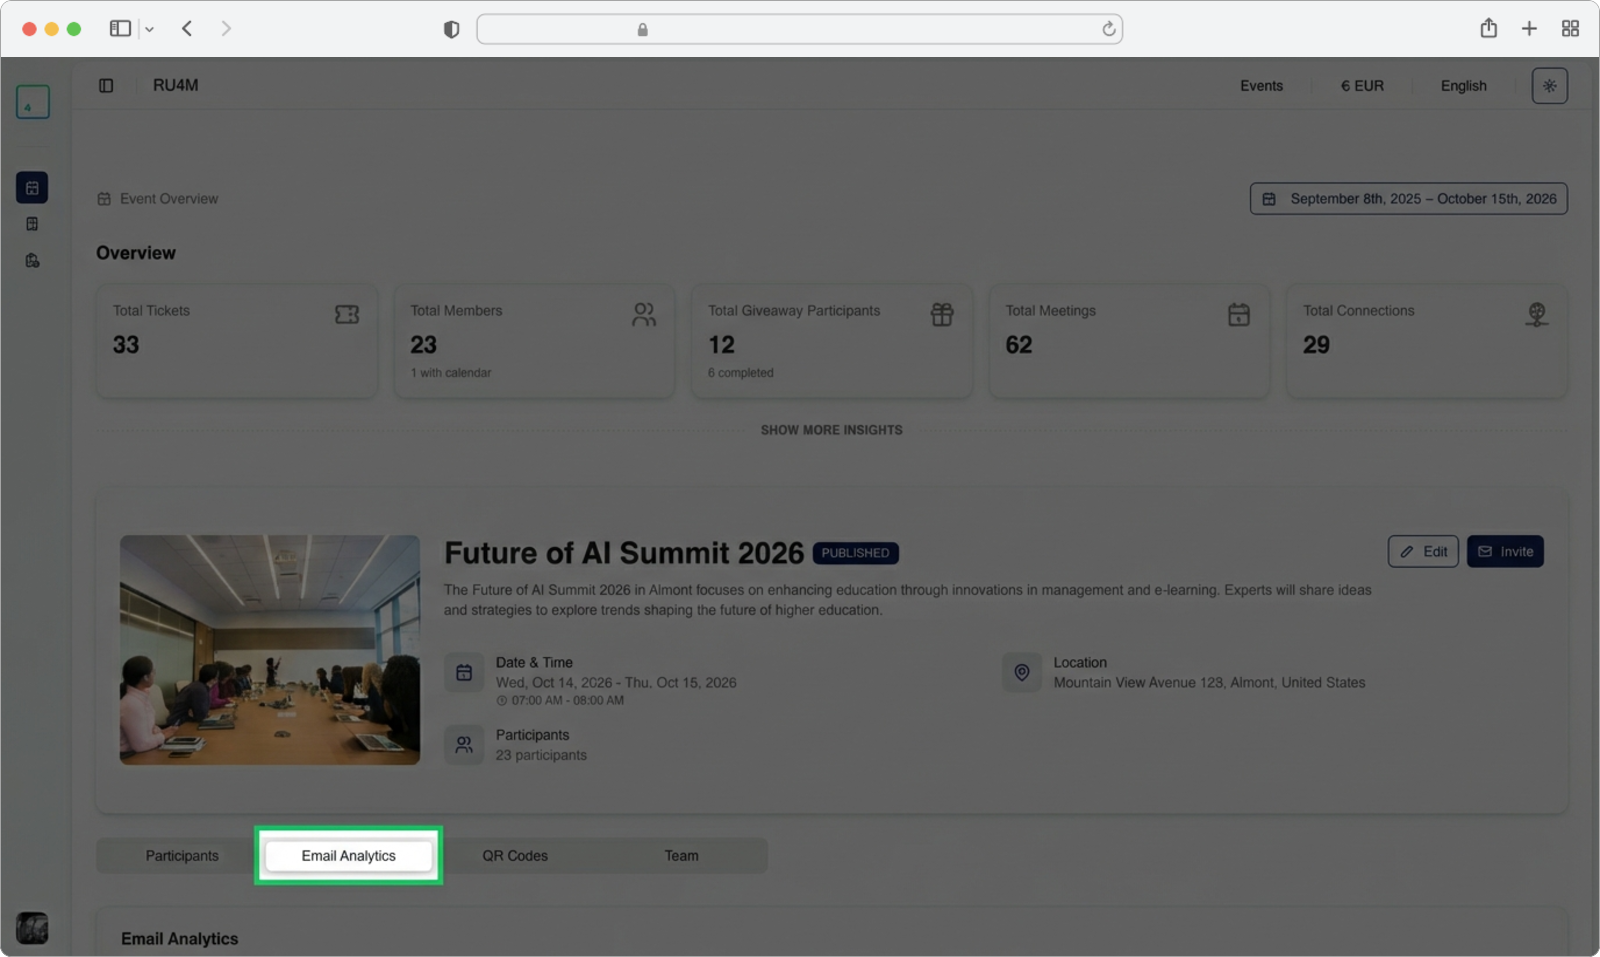
On the event details page, you will see several tabs across the top of the content area (such as "Overview", "Participants", "Email Analytics", "QR Codes", "Teams").
Click on the "Email Analytics" tab. The analytics dashboard will load below, showing the same delivery metrics, engagement data, issues, and overview chart described in Path 1 above. You may need to scroll down to see all sections of the dashboard.
Tip
Both paths show exactly the same analytics data. Path 1 (via the side menu) is useful when you want to quickly switch between different events' analytics. Path 2 (via the event page) is convenient when you are already looking at a specific event and want to check its campaign performance without navigating away.